 In an analysis of data from the 2016 Life Insurance Ownership study, LIMRA finds that LGBT market aligns with the total market in regards to financial concerns and planning, especially around life insurance ownership.
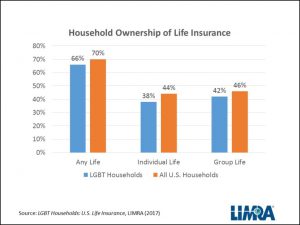
About two-thirds of LGBT households own some type of life insurance, only slightly lower than the ownership rate of all U.S. households (66 percent versus 70 percent), according to LIMRA research.
Group and individual life insurance ownership was also just slightly lower than all U.S. households, with 42 percent of LGBT households owning group life insurance (versus 46 percent) and 38 percent of LGBT households owning individual life insurance (versus 44 percent).
The income replacement ratio, the ratio of total life insurance coverage to annual household income, is 3.1 years for insured LGBT households, which is slightly higher than the average of 3.0 years reported for all U.S. households.
What LGBT consumers want
Like all consumers, LGBT consumers are interested in receiving advice for several financial-planning activities. The top three financial activities LGBT consumers would like help with are:
- A savings strategy (80%)
- Retirement Planning (80%)
- A plan to provide financial help if they or their spouse or partner were to die (78%)
While these were not the top three for all U.S. households, they were in the top five. Savings strategy was still number one with 82 percent, retirement needs was third with 80 percent, and in fourth place was a plan to provide financial help if they or their partner were to die--at 80 percent, as well.
The research also finds that LGBT parents are more interested in plans for saving for their children’s education, compared to all married couples with children (57 percent versus 42 percent).
The findings are based on a sub-sample of 281 LGBT households from the original sample of 4,167 households. The survey was conducted online in the first quarter of 2016 and was weighted to the U.S. population by age, income, race and region.
LIMRA


.png?width=300&height=300&name=CC%202025%20Ad%20(300%20x%20300%20px).png)
.png?width=300&height=600&name=Tax%20Talk%20Graphic%20-%20email%20tower%20(300%20x%20600%20px).png)


.png?width=300&name=NAIFA-FSP-LH%20with%20tagline%20-%20AT%20blog%20email%20ad%20(300%20x%20250%20px).png)
.png?width=728&height=89&name=2024%20Congressional%20Conference%20(728%20x%2089%20px).png)
